The following data represent the afternoon high temperatures for 50 construction days during a ye...
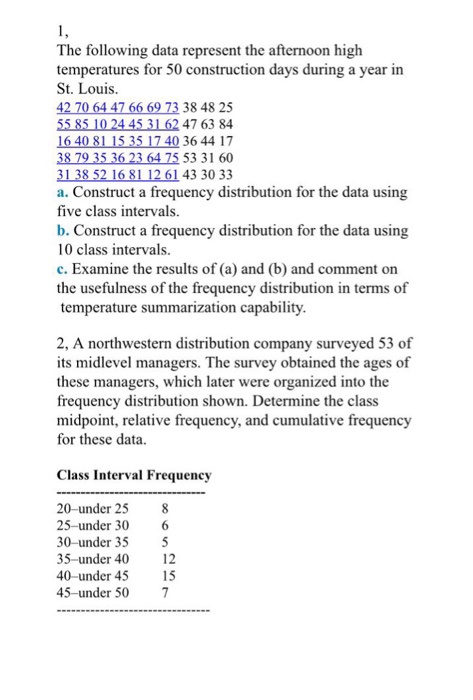
The following data represent the afternoon high temperatures for 50 construction days during a year in St. Louis. 38 48 25 55 85 10 24 45 31 62 47 63 84 16 40 81 15 35 17 40 36 44 17 38 79 35 36 23 64 75 53 31 60 a. Construct a frequency distribution for the data using five class intervals b. Construct a frequency distribution for the data using 10 class intervals. c. Examine the results of (a) and (b) and comment on the usefulness of the frequency distribution in terms of temperature summarization capability. 2, A northwestern distribution company surveyed 53 of its midlevel managers. The survey obtained the ages of these managers, which later were organized into the frequency distribution shown. Determine the class midpoint, relative frequency, and cumulative frequency for these data Class Interval Frequency 20-under 25 8 25-under 30 6 30-under 355 35-under 40 12 40-under 45 15 45-under 50 7
Solved
COMPUTER SCIENCE
1 Answer
Amol Chauhan
Login to view answer.