Task III Figure 2 shows a graph of v, versust for the motion of a car as the driver starts from v...
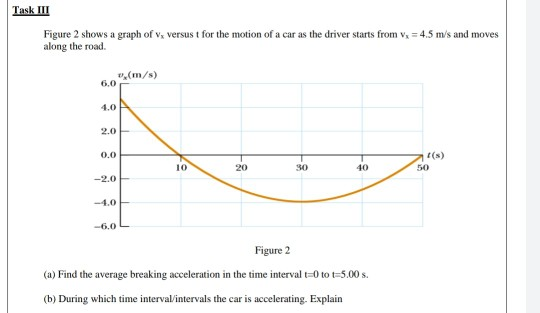
Task III Figure 2 shows a graph of v, versust for the motion of a car as the driver starts from vx = 4.5 m/s and moves along the road. ,(m/s) 6.0 4.0 2.0 0.0 (s) 10 20 30 10 50 -2.0 -6,0 Figure 2 (a) Find the average breaking acceleration in the time interval t=0 to 5.00 . (b) During which time interval/intervals the car is accelerating. Explain
Solved
Physics
1 Answer
John Smith
Login to view answer.