Task 1: The figure below represents part of the performance data of a car owned by a physics stud...
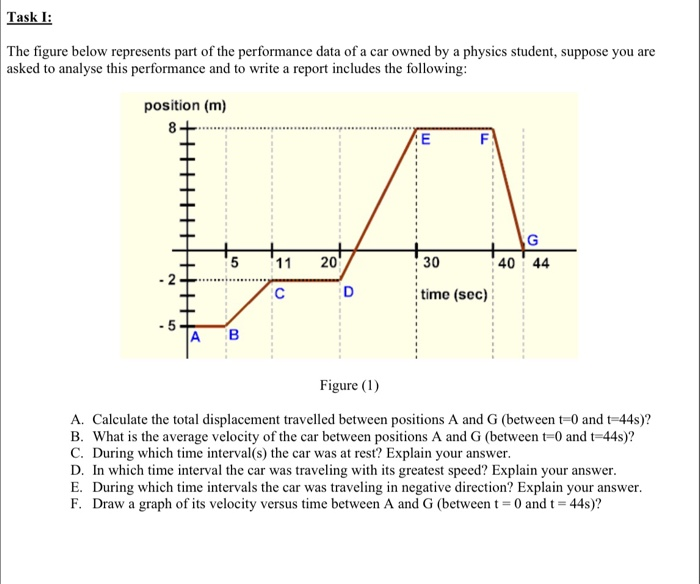
Task 1: The figure below represents part of the performance data of a car owned by a physics student, suppose you are asked to analyse this performance and to write a report includes the following: position (m) 8 E H G 40 44 -- 5 11 20 30 2 с D time (sec) an A B Figure (1) A. Calculate the total displacement travelled between positions A and G (between t=0 and t=44s)? B. What is the average velocity of the car between positions A and G (between t=0 and t=44s)? C. During which time interval(s) the car was at rest? Explain your answer. D. In which time interval the car was traveling with its greatest speed? Explain your answer. E. During which time intervals the car was traveling in negative direction? Explain your answer. F. Draw a graph of its velocity versus time between A and G (between t = 0 and t = 44s)?
Solved
Physics
1 Answer
Hassan Riaz
Login to view answer.