Question #6 A Pareto chart is a type of chart that contains both bars and a line graph, where ind...
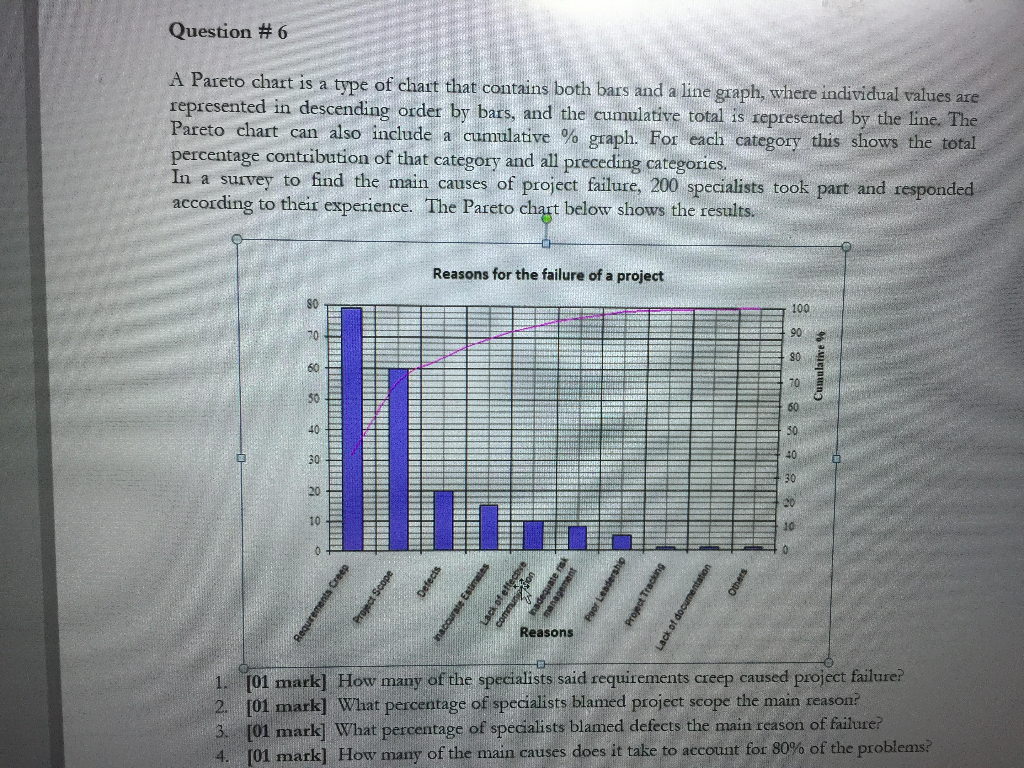
Question #6 A Pareto chart is a type of chart that contains both bars and a line graph, where individual values are represented in descending order by bars, and the cumulative total is represented by the line. The Pareto chart can also include a cumulative % graph. For each category this shows the total percentage contribution of that category and all preceding categories. In a survey to find the main causes of project failure, 200 specialists took part and responded according to their experience. The Pareto chart below shows the results. Reasons for the failure of a project 100 90 80 60 Cumulative % SO 40 30 10 ate ensi Requirements Creep Project Scope Lack of effective communior Poor Leadershi Project Tracking Reasons Lack of a 1. [01 mark] How many of the specialists said requirements creep caused project failure? 2. [01 mark] What percentage of specialists blamed project scope the main reason? 3. [01 mark] What percentage of specialists blamed defects the main reason of failure? 4. [01 mark] How many of the main causes does it take to account for 80% of the problems?
Solved
Supply Chain Management/Operations Management
1 Answer
kang wei
Login to view answer.