Q#1: Tompkins Associates reports that the mean clear height for a Class A warehouse in the United...
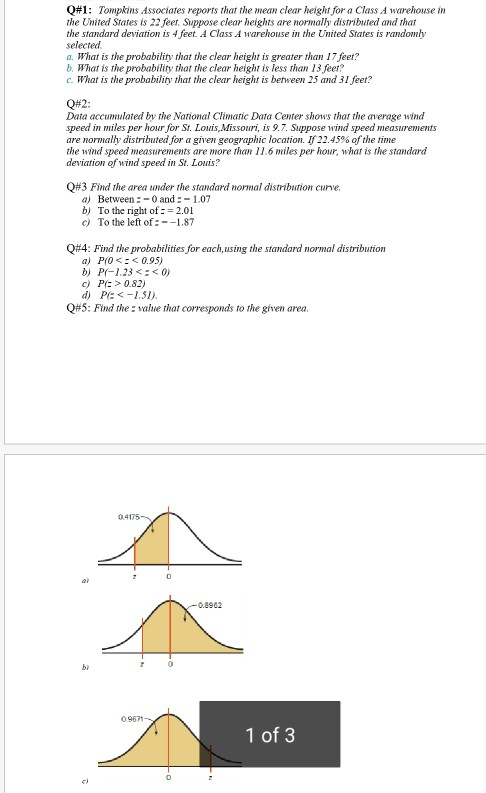
Q#1: Tompkins Associates reports that the mean clear height for a Class A warehouse in the United States is 22 feet. Suppose clear heights are normally distributed and that the standard deviation is 4 feet. A Class A warehouse in the United States is randomly selected a. What is the probability that the clear height is greater than 17 feet? 5. What is the probability that the clear height is less than 13 feer? c. What is the probability that the clear height is between 25 and 31 feet? Q#2: Data accumulated by the National Climatic Data Center shows that the average wind speed in miles per hour for St. Louis, Missouri, is 9.7. Suppose wind speed measurements are normally distributed for a given geographic location. If 22.45% of the time the wind speed measurements are more than 11.6 miles per hour, what is the standard deviation of wind speed in St. Louis? Q#3 Find the area under the standard normal distribution curve. a) Between :-O and :- 1.07 b) To the right of := 2.01 c) To the left of:--1.87 Q#4: Find the probabilities for each using the standard normal distribution a) PIO<:<0.95) b) P(-1.23<:<0) c) Plc > 0.82) d) PE<-1.51). Q#5: Find the value that corresponds to the given area. 0.4175- -0.8962 b) 09671- 1 of 3
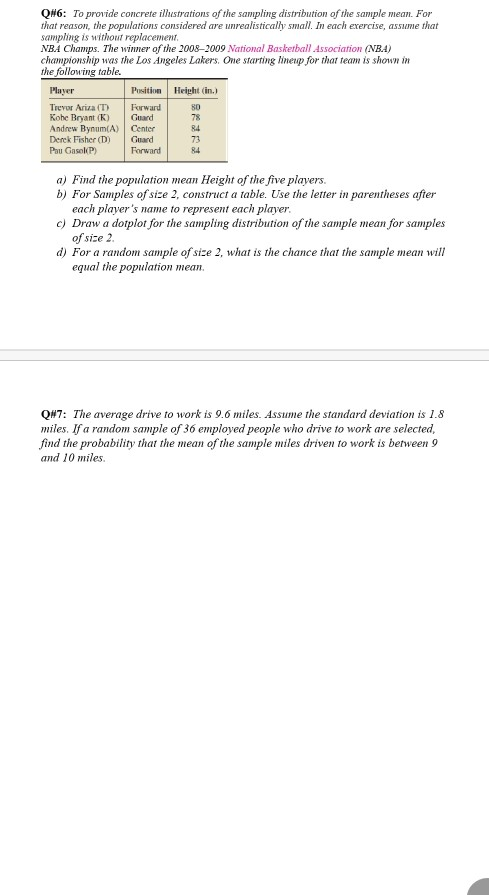
Q#6: To provide concrete illustrations of the sampling distribution of the sample mean. For that reason, the populations considered are unrealistically small. In each exercise, assume that sampling is without replacement. NBA Champs. The winner of the 2008-2009 National Basketball Association (NBA) championship was the Los Angeles Lakers. One starting lineup for that team is shown in the following table. Player Position Height (in.) Trevor Ariza (T) Forward 80 Kobe Bryant (K) Guard 78 Andrew Bynum(A) Center 84 Derek Fisher (D) Guard 73 Pau GasokP) Forward 84 a) Find the population mean Height of the five players. b) For Samples of size 2, construct a table. Use the letter in parentheses after each player's name to represent each player. c) Draw a dotplot for the sampling distribution of the sample mean for samples of size 2. d) For a random sample of size 2, what is the chance that the sample mean will equal the population mean. Q#7: The average drive to work is 9.6 miles. Assume the standard deviation is 1.8 miles. If a random sample of 36 employed people who drive to work are selected find the probability that the mean of the sample miles driven to work is between 9 and 10 miles
Solved
STATISTICS
1 Answer
Regin Iyas
Login to view answer.